Thermodynamic analysis of an electric underfloor heating system
The article presents the results of a thermodynamic simulation study, comparing Wood Plastic Composite (WPC) floorboards with ceramic and stoneware floor tiles, heated with an electric underfloor heating system, for both dry and wet assemblies.
Thermodynamic analysis of an electric underfloor heating system
The article presents the results of a thermodynamic simulation study, comparing Wood Plastic Composite (WPC) floorboards with ceramic and stoneware floor tiles, heated with an electric underfloor heating system, for both dry and wet assemblies. The different floor finishes have been modelled in a multi residential building, in Madrid (Spain) climate, using the DesignBuilder-EnergyPlus simulation tool.
The objective of the study is to analyse the dynamic thermal response of each kind of floor finish, comparing heating energy consumption, peak heating power, floor surface temperature and indoor air temperature.
Floor types
The Table below shows the different types of floor systems that were modelled:

Calculation model
The DesignBuilder tool with the EnergyPlus thermodynamic calculation engine has been used for the simulations.
A multi-residential 4 storey building has been modelled, consisting of 4 dwellings per floor, each with ~ 86 m2 of net floor area, and 342.1 m2 of total heated floor area. The second floor of the building has been modelled for the study, with the floors above and below modelled as adiabatic (they are assumed to be occupied and heated, with the same occupancy and internal heat gain conditions).


The exterior walls are cavity wall with a 14 cm perforated brick outer layer, 5 cm air-void, 6 cm of thermal insulation, and 9 cm of interior hollow brick layer, with 1cm of gypsum plaster (U = 0,39 W/m2·K). The dwellings have aluminium window frames with thermal breaks (Uf = 3,6 W/m2·K) and air-filled double glazing (Ug = 2,9 W/m2·K & g = 69%). The dwelling have mechanical ventilation with an average air change rate of 0.63 ach, with sensible heat recovery that has a efficiency rate of η = 70 %. For dwellings, air infiltration has been calculated as N50 = 5/h, converted to atmospheric pressure and applied to each zone according to its exposed area. Common areas, as the staircase, air infiltration have been modelled with 1 ach of air infiltration.
The energy consumption of all 4 homes on the second floor has been analysed, with a detailed analysis of Room 1 (oriented to the southwest).
Electric radiant floor system
An electric radiant floor system has been modelled. Heating mats with the following nominal power capacities were simulated under each type of flooring:
- Wood Plastic Composite (WPC) floor (direct system): 75 W per linear metre
- Wood Plastic Composite (WPC), with self-levelling mortar screed: 116 W per linear metre
- Stoneware/ceramic floor, with self-levelling mortar screed & gypsum plasterboards: 116 W per linear metre
The radiant floor power for each home and for Room 1 is shown in the following table. The radiant floor has been modelled as “ZoneHVAC: Low Temperature Radiant: Electric” and inserted into DesignBuilder using an EnergyPlus script.

Temperature setpoints
The heating setpoints are those indicated in Annex D “Operational conditions and usage profiles” of the Spanish Building Regulations CTE DB HE 2019:
- Main setpoint: 20 ºC (07:00 – 22:59)
- Secondary setpoint: 17 ºC
Results
The 3 periods shown in the following table have been analysed:

The following parameters have been analysed:
- Heating consumption [kWh]
- Maximum capacity of the radiant floor heating mat [kW]
- Floor temperature [ºC]
- Indoor air temperature[ºC]
Dry installation: thermal transmittance, thermal resistance, and internal heat capacity
The Figures below show the radiant floor capacity, total thermal transmittance (according to ISO 69446), thermal resistance of the materials on top of the radiant floor heating mat, and the internal heat capacity of the materials above the radiant floor (according to ISO 13786), for each type of floor, for a dry installation.


Wet installation: thermal transmittance, thermal resistance, and internal heat capacity
The following graph and table show the radiant floor capacity, the total thermal transmittance (according to ISO 69446), the thermal resistance of the materials above the radiant floor heating mat, and the internal heat capacity of the materials above the radiant floor (according to ISO 13786), of each flooring type, for a wet installation.


Dry installation: 2nd floor, heating consumption, 1st October – 31st March
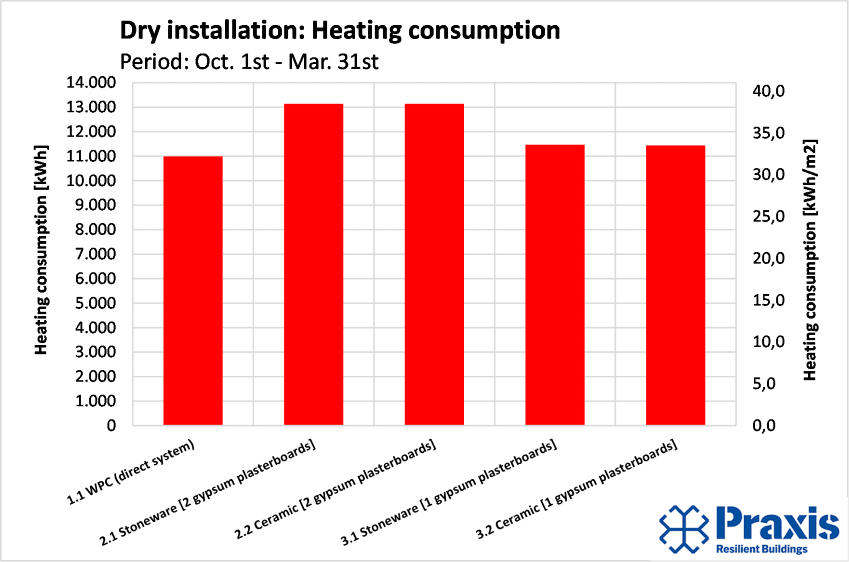
The Table and the Figure below show the results of heating energy consumption for each type of floor, for a dry installation.

The results indicate that the heating consumption of floors 2.1 Stoneware and 2.2 Ceramic with double gypsum fibreboards is 20% higher than in 1.1 WPC (direct system).
Floor consumption 3.1 Stoneware and 3.2 Ceramic with 1 dry gypsum fibreboard, is 5% and 4% higher than 1.1 WPC. These differences fall within the margin of uncertainty in the calculations (around 10%).
Wet installation: 2nd floor: heating consumption, October 1st – March 1st
The next table and graph show heating consumption results for each floor type, with wet installation.

The results indicate that heating consumption of 4.1 Stoneware and 4.2 Ceramic floors with self-levelling mortar screed, are 10% and 9% lower respectively than 1.2 WPC with self-leveling mortar screed. These differences fall within the margin of uncertainty in the calculations (around 10%).

Dry installation: Bedroom 1, floor & indoor air temperatures, radiant floor power, and solar gains, January 14th
The evolution of radiant heating mat capacity is shown in the Figures below, together with solar gains, floor surface temperature, and indoor air temperature, during the day of January 14th, for each floor type, for dry installation.
Additionally, the maximum capacity of the radiant heating mat, the time at which maximum capacity occurs, and the maximum floor surface temperature (before the effects of solar radiation) are shown.
The heating setpoint and setback temperatures (20 ºC from 7:00 – 23:00 and 17 ºC the rest of the day) determine when the radiant floor is turned on or off. Solar gains provoke sudden rises in indoor air and floor surface temperatures when the radiant floor is off.


The table and graphs above show that the delay between radiant heating mat’s maximum capacity and maximum floor temperatures, is around 4 hours for the 1.1 WPC, approximately 6 hours for stoneware floor and ceramic floor with 2 gypsum fiberboards, and approximately 5 hours with 1 gypsum fiberboard.
This is mainly because the thermal resistance and thermal capacity of the 1.1 WPC (direct system) is lower than with the stoneware and ceramic floors with gypsum fiberboards, therefore takes less time to warm up and transmit heat to the room.
Wet installation: Bedroom 1, floor & indoor air temperatures, radiant floor power, and solar gains, January 14th
The graphs below show the evolution of the radiant heating mat power capacity, solar gains, floor surface temperature, and indoor air temperature, during January 14th, for each floor type, for a wet installation.
The radiant heating mat maximum capacity, the time at which maximum capacity occurs, and the maximum floor surface temperature (before the effects of solar radiation) are shown. For the 1.2 WPC, the maximum floor temperature takes place at 12:00 due to the heat emitted by the radiant heating mat; from that time on, the increase in floor temperature is due to solar gains.


The above graphs and table indicate the time delay between the radiant floor’s maximum capacity and the floors maximum temperature, for the WPC, stoneware, and ceramic floor with self-leveling mortar screed, is around 5 hours in all three cases.
Although the heat capacity of the materials above, the radiant floor of floor types 4.1 and 4.2 is far greater than the 1.2 WPC, the thermal resistance of these materials is much lower, so the dynamic response and heating consumption is similar.
Conclusion
The results of the dry installations, indicate that the Wood Plastic Composite flooring has lower energy consumption (between 4% and 20%) and a slightly faster thermal response. In the case of floors with wet installation, the results indicate that the Wood Plastic Composite flooring has a slightly higher energy consumption (between 9% and 10%) and a thermal response similar to the other floor types analyzed. In both cases, given the margin of uncertainty of the calculation, the difference is minimal.